|
<< Click to Display Table of Contents >> How to Make a Gauge |
  
|
|
<< Click to Display Table of Contents >> How to Make a Gauge |
  
|
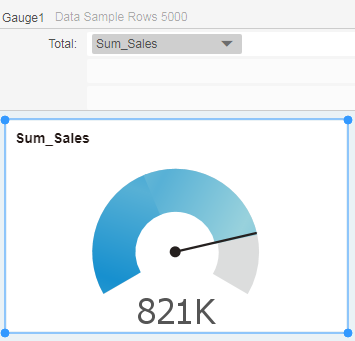
Gauges are often used to display aggregated data. This section uses the Joint Table of Chinese Coffee Data to show you how to use the gauge to calculate the total sales of products.
1.Add Component
From the right Component pane, drag the gauge component ![]() to the editing area.
to the editing area.
2.Bind Data
From the left data list, drag measure "Sales" to the gauge area.

3.Set Gauge Style
1)With the gauge component selected, click Gauge Style in the General pane on the right.
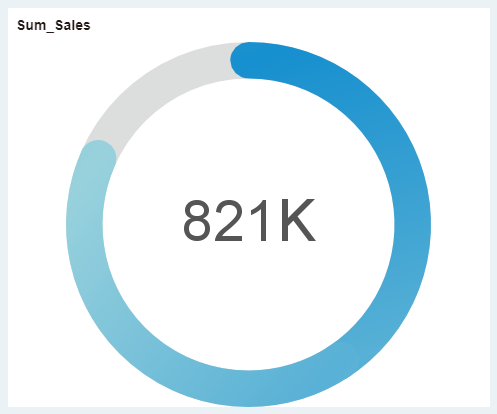
2)In the pop-up dialog, select the desired gauge style.

Finally get the following gauge.
