|
<< Click to Display Table of Contents >> How to Make a One-dimensional Table |
  
|
|
<< Click to Display Table of Contents >> How to Make a One-dimensional Table |
  
|
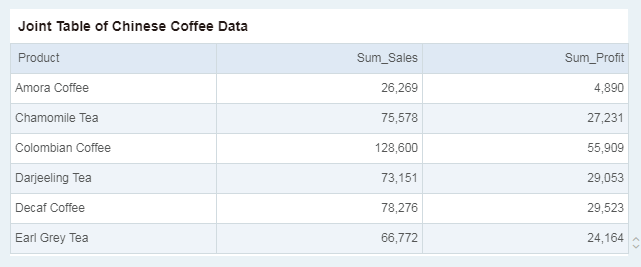
A table is a carrier for displaying data and can bind multiple fields of any data set; it can display both detailed data and aggregated data. This section uses the Join Table of Chinese Coffee Data to show you how to use a one-dimensional table to display product sales and profit.
1.Add Component
From the right component pane, drag the table component ![]() to the editing area.
to the editing area.
2.Bind data
In the left data list, drag and drop the dimension "Product" and the measure "Sales" and "Profit" in the binding area.
Finally get the following table.
