|
<< Click to Display Table of Contents >> How to Make a Two-dimensional Table |
  
|
|
<< Click to Display Table of Contents >> How to Make a Two-dimensional Table |
  
|
A two-dimensional table, also called a pivot, can bind multiple fields of any data set. Two-dimensional tables are often used to display aggregated data. This section uses the Joint Table of Chinese Coffee Data to show you how to use two-dimensional tables to display product sales and profit.
1.Add Component
From the right Component pane, drag the pivot component ![]() to the editing area.
to the editing area.
2.Bind data
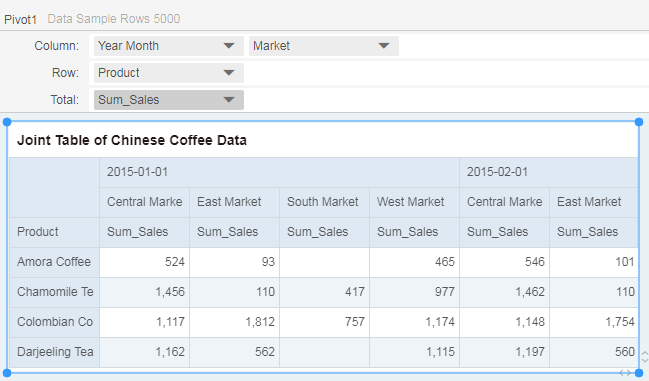
In the left data list, drag the dimensions "Year Month", "Market" to the Column area, dimension "Product" to the Row area, and drag the measure "Sales" to the Total area. Then get the following table.

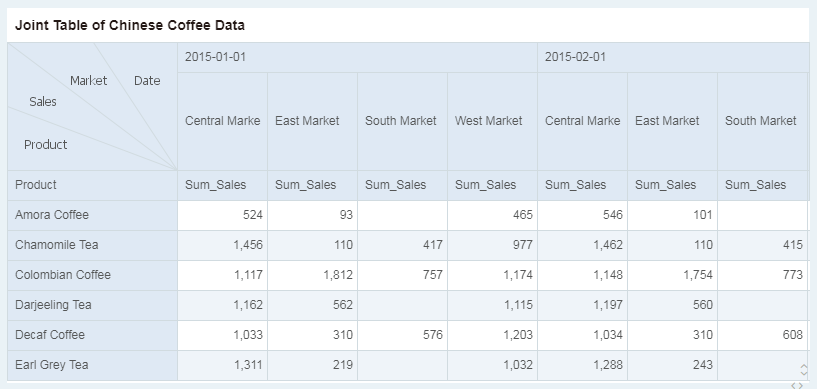
At this point, the person who read the pivot does not know whether these numbers represented profit, sales, sales volume, or other meanings. So we need to add a slash header to this pivot.
3.Make Slash Header
1)Select the cell that need to set header. In the General pane on the right, select "Cell Render".
2)In the cell render window, select "Slash" and enter the contents of the header, separated by commas.

Finally get the following chart.
