|
<< Click to Display Table of Contents >> Stacked Point Chart |
  
|
|
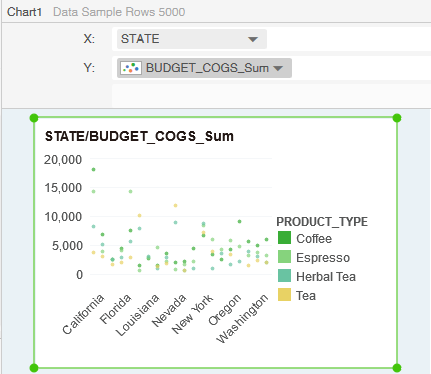
<< Click to Display Table of Contents >> Stacked Point Chart |
|
Stacked point plots can be used to show the trends in the distribution of individual values over time or in sorted categories, however, since it is difficult to see piled points, use the line chart or the stacked area chart to instead.