|
<< Click to Display Table of Contents >> Pie&3D Pie |
  
|
|
<< Click to Display Table of Contents >> Pie&3D Pie |
  
|
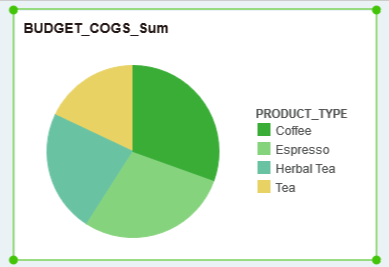
Pie charts only bind metric fields on the X-axis or Y-axis.Pie chart shows the ratio of the size of each item in one data series (data series: related data points plotted in a chart, which are derived from rows or columns of a data table. Each data series in the chart has a unique color or pattern and is represented in the chart legend. You can draw one or more data series in a chart. A pie chart has only one data series.) to the sum of items.The data points in the pie chart are shown as a percentage of the entire pie chart. (Data points:Data point: A single value drawn on a chart by a bar, a line, a pie, a donut chart or other marks. Data Marks of the same color make up a data series. )

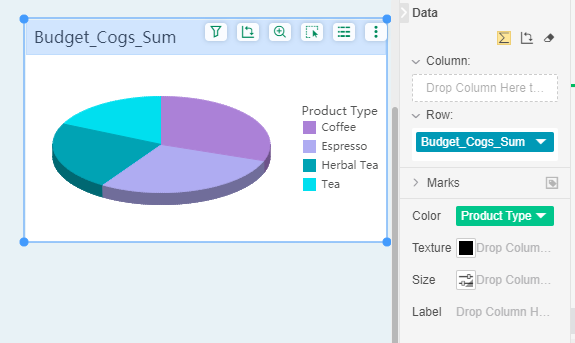
3D pie charts use 3D perspective effects to display data.
