|
<< Click to Display Table of Contents >> Map |
  
|
|
<< Click to Display Table of Contents >> Map |
  
|
Users can use maps to measure sales and other indicators in different regions.
The map is divided into two data types, one is regional data and the other is point data. Refer to the following table for specific names. Where ‘Custom’ is user-supplied map data.
Geographic Information |
Regional Data |
Point Data |
|---|---|---|
customize |
Zone |
Point |
Global Continents |
Continent(Area) |
Continent(Point) |
Global Countries |
Country |
City |
Global Provinces |
Provinces |
City |
Global Cities |
City(Area) |
City(Point) |
Global Prefectures |
County(Area) |
County(Point) |
Australia |
State |
City |
France |
Region |
Department |
Canada |
Provinces |
City |
USA |
State |
Country |
Japan |
Region |
Country |
UK |
United Kingdom |
Country |
China |
Provinces |
City |
Thailand |
Prefecture |
County/District/Village |
Singapore |
Country |
NA |
Vietnam |
Province |
City/County |
There are two kinds of regional data rendering methods: region rendering, point rendering, migration rendering, and thermal rendering. Users can select the rendering type in the drop-down list of bound fields; point data does not support area rendering and can only be point rendering and migration. Rendering, heat rendering.
❖Map location
There are two ways to locate in the map, positioning by latitude and longitude and positioning by landmarks.
•Positioning by latitude and longitude
Latitude and longitude The received field type is a numeric type field under the dimension and metrics catalog.
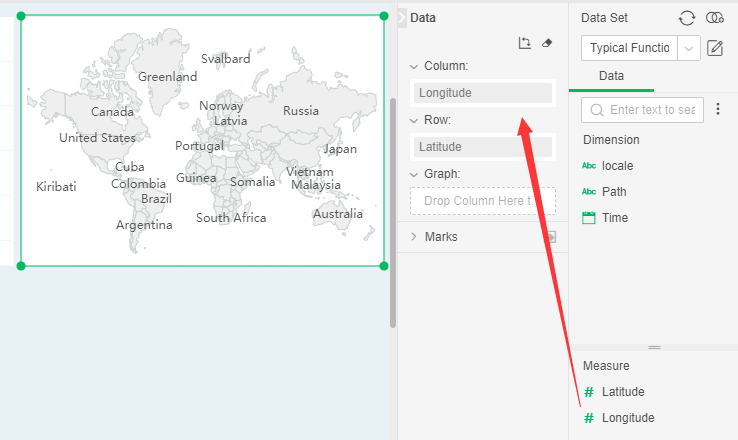
If the latitude and longitude fields are bound for the first time, the corresponding countries and regions will be automatically matched according to latitude and longitude data.
In the drop-down list of the bound metric field, you can set the geographic information, for example: countries in the world, China, the United States, and so on.
Latitude and longitude data types are point data. You can select the rendering methods from the drop-down list of the bound measure field: point rendering, migration rendering, or heat rendering.
•Targeting by landmarks
The field type that the landmark line receives is a string type. When the field is bound at the landmark, the field must be converted to a map column before it can be bound, as shown in the following figure:
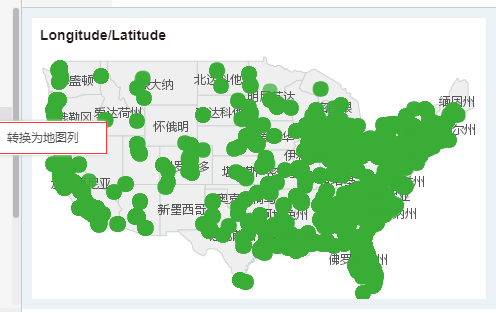
If the user edits the map column for the first time, a prompt dialog box will pop up: The map column is a global property. Continue to modify? If you select “Yes” and check “Remember my choice”, then modify the attribute and no longer pop up this prompt. If you select “No”, it will not be modified. If you accidentally mis-select "Remember my choice", you need to exit the product and clear the browser (cookie) cache. Select “Yes” to open the map column dialog box, as shown in the figure:
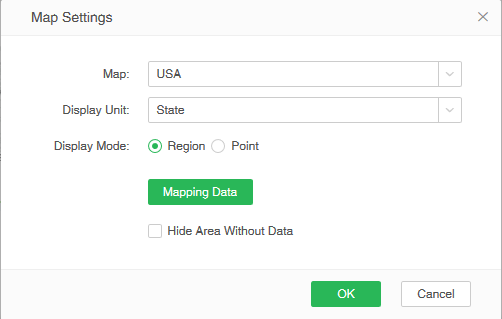
[geographical information] Select the geographical information of the map, such as the countries of the world, the provinces of the world, the cities of the world, the county seats of the world (currently only covering China), China, the United States and so on.
[geographical data] The matching data type of the map, ‘country’ is the area data, there are two rendering methods: area rendering and point rendering, the user can select the rendering type in the drop-down list of the bound field. ‘City’ is point data can only be point rendering.
[Geographic Data Matching] Click the hyperlink [Data Not Matching] to open the Geodata Matching dialog box and perform data matching, as shown in the following figure:
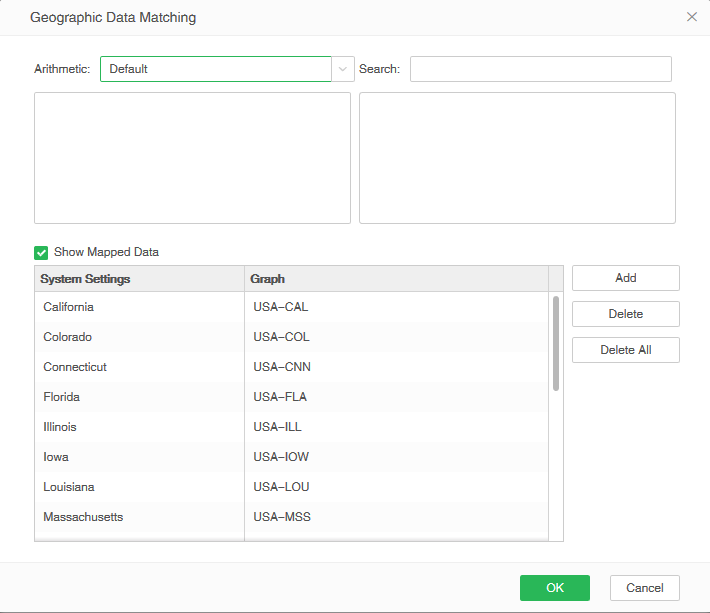
There are four matching algorithms provided here. The matched data will be displayed in the map. After all the data are matched and determined, the geographic data matching items in the map column dialog box will become data matching. After the determination, the results are as shown in the following figure:

[Hide no data area] After checking, the map display scope will be optimized as shown in the figure:

➢Note: Matching of geographic data supports automatic matching: When you bind a map column or open a report, if the map column data is updated, the data will be automatically matched.
❖Rendering Type
The user can select the type in the drop-down list of the bound field: area rendering, point rendering, migration rendering, thermal rendering. The user can select a map of the world or a specific country. The presentation mode is a region rendering, a point rendering, a migration rendering, or a thermal rendering. The migration rendering and the thermal rendering refer to the migration map and the heat map.
The world map and area rendering are shown in the figure below:

The Chinese map is a point rendering as shown below:
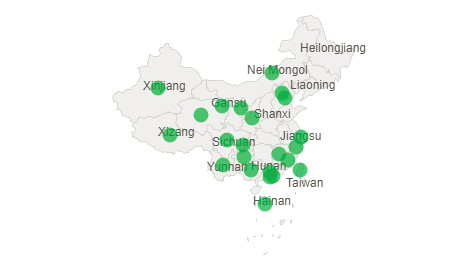
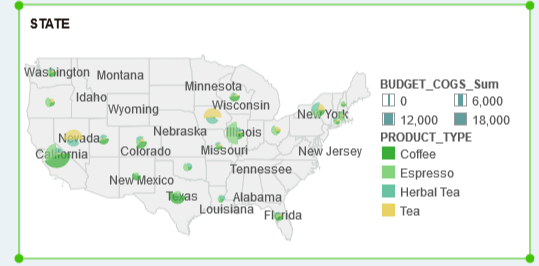
When the type of map selection is point rendering, you can mark the point above the map as a pie chart. You only need to bind the corresponding field on the landscaping interface, as shown in the following figure:
❖Custom Area Data
Support geographic group grouping behavior, which can be displayed by large area (such as North America, South America...), and can be combined with geographic data of provincial and municipal equivalent levels to become a region for display.
Click Customize in the presentation hierarchy, as shown in the following image:
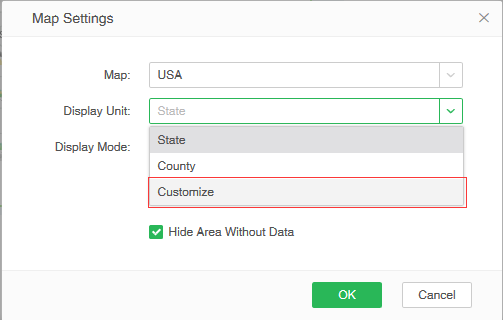
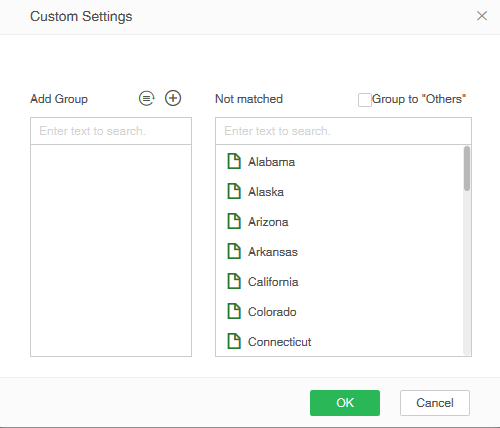
Click Customize and the "Customize Settings" button appears. Click to enter the custom dialog.
When the geographic information is different, the data of the level can be separately grouped:
•World
When the map range selects the world, in the Custom Settings dialog box, the hierarchy is selected as the continent, and the geographic data is the large area. The ungrouped data is the data of the world continent, as shown in the figure:
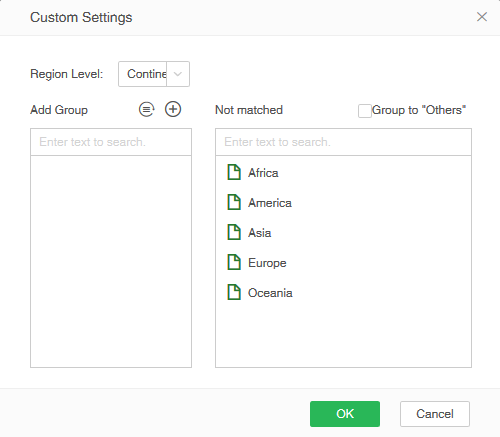
For example, in the case of continents, when the map is in the world, the level can also be selected as the country, province, city, and county.
[Group to "Other"] Checking this option will generate a group with the name "Other". If some data is not grouped, it will be placed under the "Other" group.
[New Group] Click the New button in the group area to generate a group. The default name is Group 1, Group 2... After the new screen, the cursor will be selected and the group name can be modified. The newly created group can be dragged into the geography from the right. data.
[Rename] Select a group and click Rename to modify the name of the group.
[Delete] Select a group, click Cancel Group, the current group is cleared.
[Reset] Clear all packets.
•Country
Take the map range selection as an example for China. The customized settings page is shown below. The default grouping information is the information of China Region. It can be customized by creating new grouping, renaming, etc.
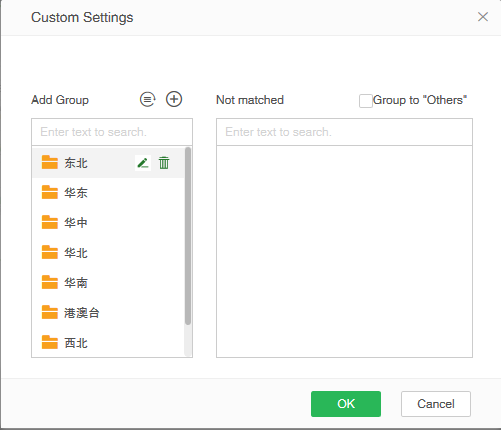
The product provides the Chinese default area:
oNortheast: Jilin, Liaoning, Heilongjiang;
oEast China: Shanghai, Anhui, Shandong, Jiangsu, Zhejiang, Fujian;
oCentral China: Jiangxi, Henan, Hubei, Hunan;
oNorth China: Inner Mongolia, Beijing, Tianjin, Shanxi, Hebei;
oSouth China: Guangdong, Guangxi, Hainan;
oHong Kong, Macao and Taiwan: Taiwan, Macau and Hong Kong;
oNorthwest: Ningxia, Xinjiang, Gansu, Shaanxi and Qinghai;
oSouthwest: Yunnan, Sichuan, Tibet, Guizhou, Chongqing;
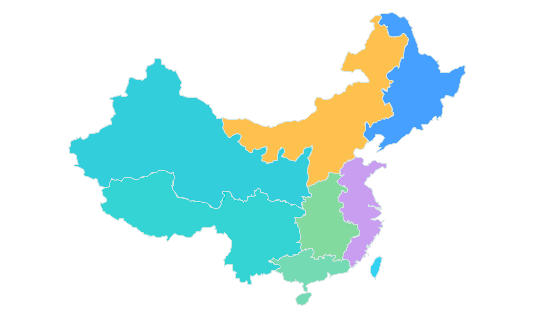
After matching the data, you can draw a map of China divided into regions, as shown in the figure:
If the user needs to display China according to the group set by himself, the default large area grouping data can be edited.
➢Note: When setting up a custom region in Australia, France, Canada, the United States, Japan, and the United Kingdom, the method of use is the same as China.
❖Map Drill
Map inherently exists at a certain level (Hierarchy). For example, it is global at first. Users can select China, drill down, and it will show various provinces in China. Select Guangdong and drill down, it will show cities in Guangdong, and you also can return through drilling up. There are two kinds of map definition, one is through the landmark column, the other is through the x, y latitude and longitude binding, the first to support the drill, the second does not matter the upper and lower levels of relationship, it does not support.
When the user binds a field with a hierarchy, you can directly drill or drill down by right-clicking on the map, as shown in the following figure:
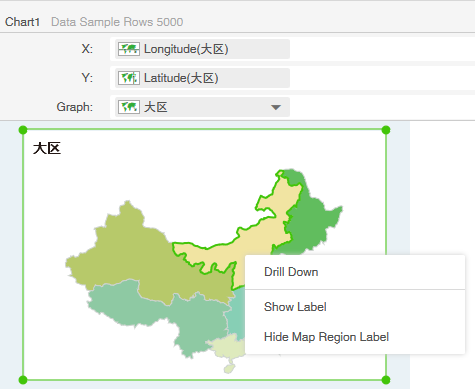
The region also supports drill-down. After setting levels, you can drill right click on the map, as shown in the figure:

❖Map Color
The map has four colors. The background color of the map is the default gray. The color of the data area can be modified by beautifying the colors on the interface. The color of the split line between the non-data area color and the map block can be modified to its default color by setting in bi.properties. For example, if you want to set the non-data area color to light green and the map block split line to red, add map.empty.color=10018698,map.line.color=color=16711680 to bi.properties and restart tomcat. Note that the color is represented by a decimal number of type int.
❖Map Option
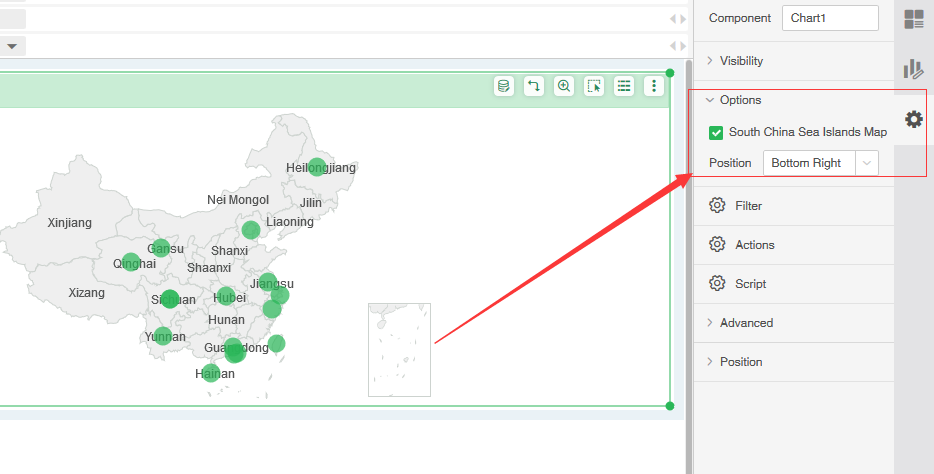
When the bound data is the provincial and municipal data of China, in the right pane, the South China Sea Island area can be set as a small image placed in the lower left or lower right of the component, as shown in the figure:
