|
<< Click to Display Table of Contents >> Set Metadata Schema |
  
|
|
<< Click to Display Table of Contents >> Set Metadata Schema |
  
|
After clicking this item, all components in the dashboard will enter its metadata mode.
Suppose there is data in the table below.

The metadata schema corresponding to each data type in the above table is shown in the following table.

Assume that there is time type data in a table, as shown in the following table.

The metadata mode corresponding to each data type in the above table is shown in the following table, and the current time is collected.

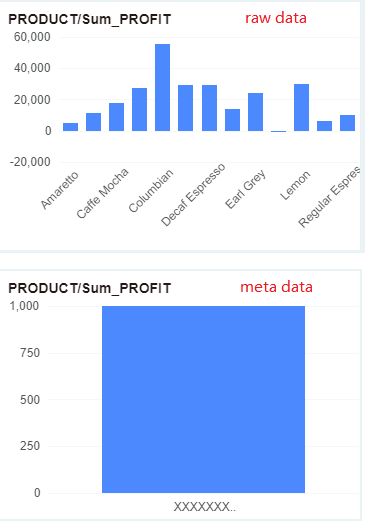
If the graph's Row axis is bound to numeric data, it is displayed in the metadata mode as 0-1000, as shown in the following figure.
