|
<< Click to Display Table of Contents >> Set Chart Title |
  
|
|
<< Click to Display Table of Contents >> Set Chart Title |
  
|
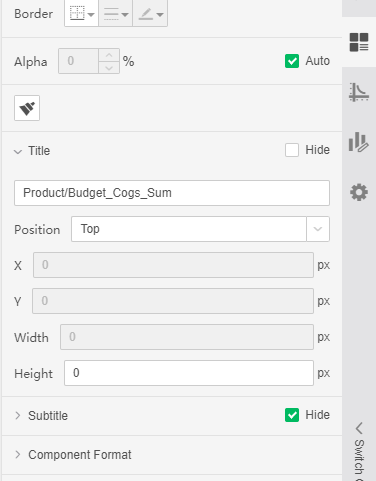
In the right panel => General, you can set title options and hide the title, as shown in the following figure:

❖Title
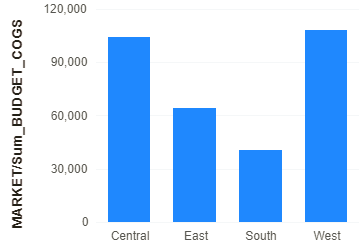
The user can set the name of the title and the position of the title. When selecting left or right, the user can set the width of the title; when selecting the top or bottom, the user can set the height occupied by the title; when the user chooses to float, the user can select Set the distance from the Column axis, the distance from the Row axis, the width of the title, and the height of the title.
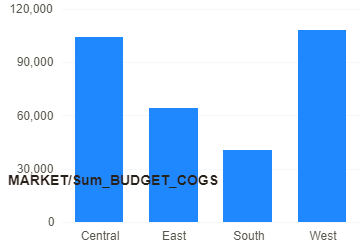
As shown in the figure below, set the title of the chart to float on the chart.

❖Hidden Title
When the user selects the Hide menu, the corresponding axis title will be hidden. When the user don't select the Hide menu , all the hidden titles are displayed again.
❖Display Subtitle
By default, when the x and y axes are present at the same time, the subtitle is displayed in the right panel => General. After removing the checked state of the Hide, the title of the Column axis and the Row axis are broken and displayed in the corresponding positions.
The default display form is as follows:

After displaying the subtitle, the title is displayed as shown below:
