|
<< Click to Display Table of Contents >> Mark Mixing Mode |
  
|
|
<< Click to Display Table of Contents >> Mark Mixing Mode |
  
|
Users can use this attribute to set the mixing mode of marks when multiple measures are used. Take bar chart as an example:
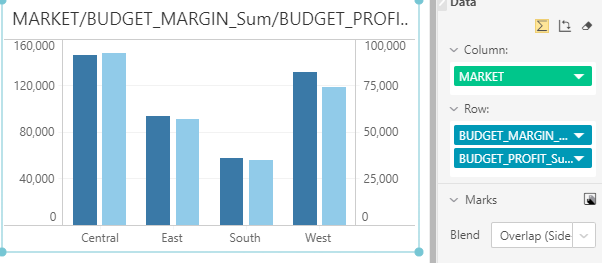
【Overlap(Side-by-side bars)】:The marks of each measure column are displayed side by side in a plot area.

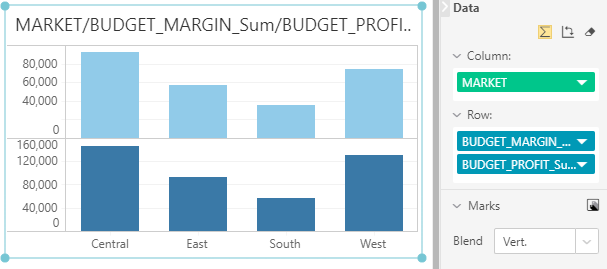
【Vert.】:The mark of each measure is separated in its own small plot area.

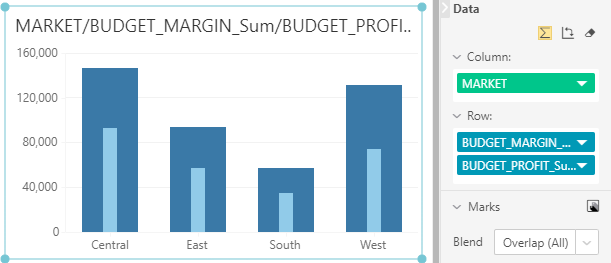
【Overlap(All)】:Multiple measurement markers corresponding to each dimension data are all overlapped together, and the effect is the same as the bullseye chart
