|
<< Click to Display Table of Contents >> Icon Aesthetic Sharing Mechanism |
  
|
|
<< Click to Display Table of Contents >> Icon Aesthetic Sharing Mechanism |
|
Up to 30 values are displayed in the legend. A mapping relationship needs to be made for the discrete data segment. The 30 values of the bound data segment correspond to the values of the aesthetic interface.Users may have their own preferences for color.When a user binds a color row of a chart to a city field and sets a color, the user may wish to bind a color row of another chart to a city field. The default color mapping relationship may not be the last mapping, and it needs the user. Then the color is modified, but it may not be consistent, which will lead to misunderstandings.The red color of a chart indicates Beijing, and the green color of another chart is Beijing. In order to reduce this drawback, a sharing mechanism is provided, and all the places where this field is used share a set of mappings.
➢For example
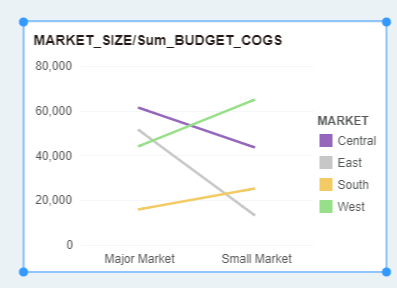
1. Create a new chart, bind the data segment to its Column and Row axis, and bind the MARKET data segment to the color line of its aesthetic interface, and edit the color of the legend, as shown in the following figure:
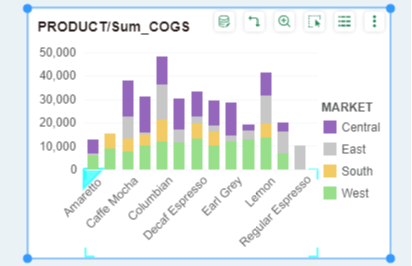
2. Create a new chart, the XY binding is different from the data segment of the chart, but the aesthetic interface is also bound to the MARKET data segment in 1), without color editing, the color of the legend is shared by default 1) The color of the legend, as shown below: