|
<< Click to Display Table of Contents >> How to Do Proportion Analysis |
  
|
|
<< Click to Display Table of Contents >> How to Do Proportion Analysis |
  
|
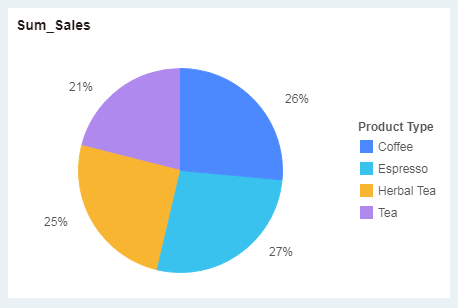
The proportion analysis usually uses a pie or rose graph. Pie charts usually show the ratio of each value to the sum value. The size of the sector in the pie chart represents the proportion.
Take the proportion of product sales as an example to introduce you how to make the proportion analysis.
1.Add Component
From the right Component pane, drag the pie chart ![]() to the editing area.
to the editing area.
2.Bind Data
From the list of data on the left, drag the measure "Sales" to the Y-axis, dimension "Product Category" to Color in Marks area.
3.Set Label
1)From the list of data on the left, drag the measure "Sales" to Label in Marks area.
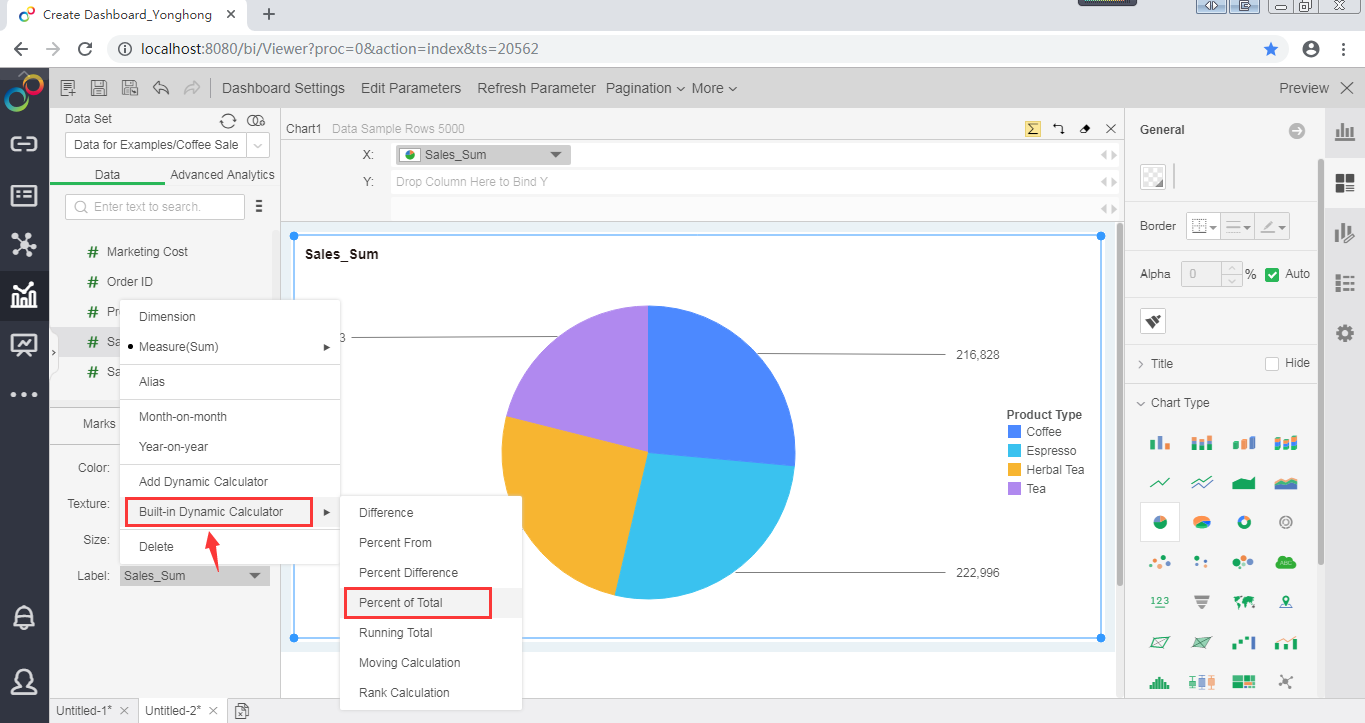
2)In the Label area, open the "Sum_Sales" operation menu and select [Built-in Dynamic Calculator] -> [Percent of Total].

In the end, we get the following proportion graph.
