|
<< Click to Display Table of Contents >> How to Find Out Abnormal Data |
  
|
|
<< Click to Display Table of Contents >> How to Find Out Abnormal Data |
  
|
To find out the abnormal data, scatter plots are usually used. Scatter plots represent the general trend of data changing with variables and are often used to display and compare values. Take the sales growth rate of the chain as an example to show you how to find the abnormal data.
1.Add Component
From the right Component pane, drag the scatter plot chart ![]() to the editing area.
to the editing area.
2.Bind Data
From the left data list, drag the dimension "Year Month" to the Column axis and the measure "Sales" to the Row axis.

3. Set Label
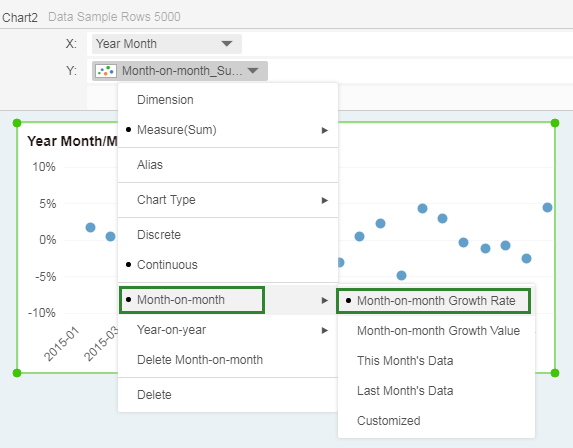
1)In the binding area, open the "Sum_Sales" operation menu and select "Month-on-month" -> "Month-on-month Growth Rate".

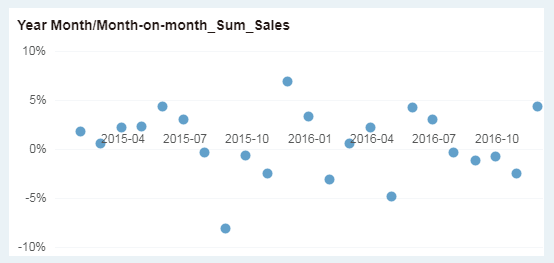
2)In the right Axis pane, in Column axis area, set the axis position to be centered.

3)In the right axis pane, in Row axis area, set the scale “0 as Axis Center”.
Finally get the following scatter plot:
