|
<< Click to Display Table of Contents >> Zoom Axis |
  
|
|
<< Click to Display Table of Contents >> Zoom Axis |
  
|
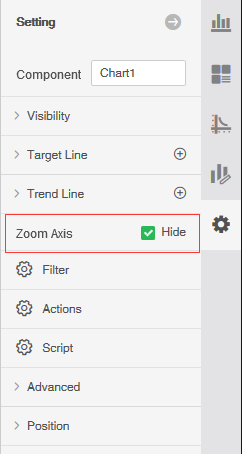
Column chart, stacked Bar, 3D Bar, 3D stacked Bar, line chart, stacked line chart, area chart, stacked area chart, histogram chart, which provide the function of displaying the zoom axis, which can display the zoom axis After that, drag and drop the zoom axis position to display the data of the corresponding area. The setting of the zoom axis is in the pane-setting on the right, as shown in the following figure:

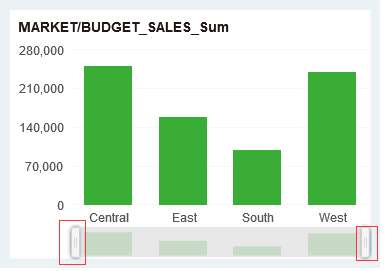
After you cancel the Hide button, the zoom axis is displayed on the chart. You can select the data area you want to view by dragging the two endpoints of the axis, or dragging the entire axis:

When you drag the scale axis, the spacing between figures such as columns and figures will be scaled equally.