|
<< Click to Display Table of Contents >> K line |
  
|
|
<< Click to Display Table of Contents >> K line |
  
|
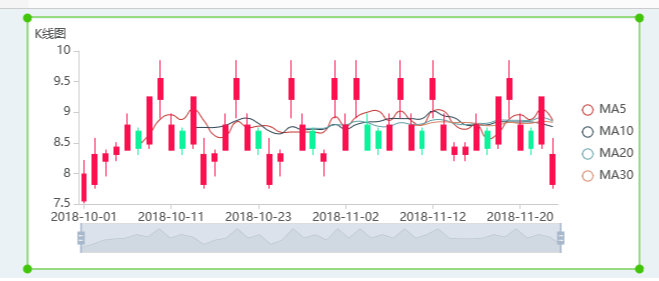
The K-line chart (Kline) is mainly used in the stock and futures markets. The drawing of the K-line chart contains four data, namely the opening price, the highest price, the lowest price, and the closing price. All the k lines are developed around these four data. , reflecting the status and price information of the general trend.
❖Create a K-line
To create a K-line diagram, drag the K-line diagram component to the report editing area in the component of the right pane, and bind the corresponding data according to the prompt of the binding area, as shown in the following figure, where MA5, MA10, etc. respectively represent 5 Day and 10 day moving average.

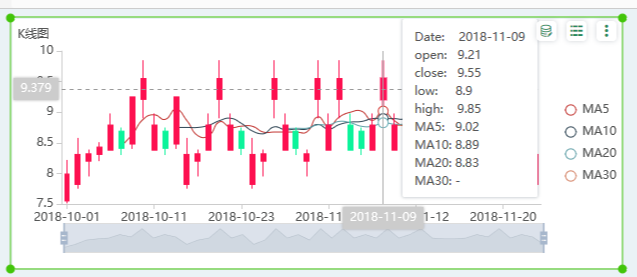
Mouse hover, you can display the data details of a certain day, as shown below:

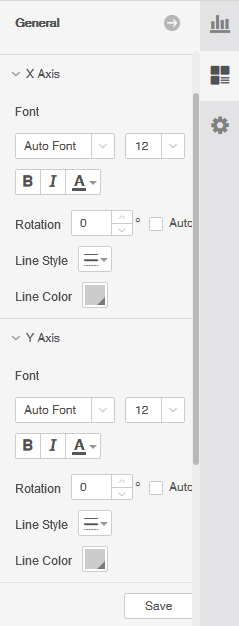
You can set the x-axis and y-axis styles of the K-line diagram in the right pane, as shown below:
