|
<< Click to Display Table of Contents >> Time Line |
  
|
|
<< Click to Display Table of Contents >> Time Line |
  
|
Timeline is a dynamic display of data from different time nodes in the same chart by adding a time dimension. In addition to the time dimension, it usually includes one dimension and two metrics.
❖Create a Timeline
Create a time track diagram, you can drag the time track diagram component to the report editing area in the component of the right pane, and bind the corresponding data according to the prompt of the binding area, as shown in the following figure, showing the change according to time. The change in GDP and average life (data is fictitious), in which the size of the binding GDP data to the point will distinguish the data point size according to the data of GDP.

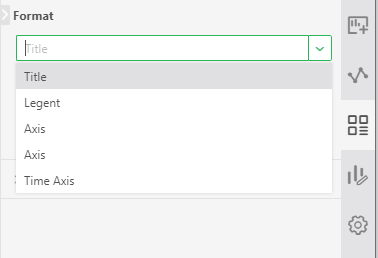
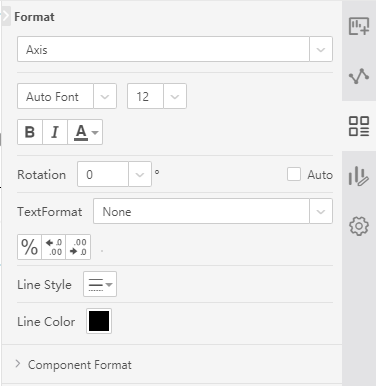
You can set the axis and timeline styles of the time track graph in the right pane, as shown in the following figure. After setting, click Save to take effect:

