|
<< Click to Display Table of Contents >> Data Grouping |
  
|
|
<< Click to Display Table of Contents >> Data Grouping |
  
|
In the table, pivot, chart components can be grouped operation, that is to say can be combined into a group of two fields, then ungrouping is the process of splitting the merged fields.
➢For example 1: grouping of tables, pivots.
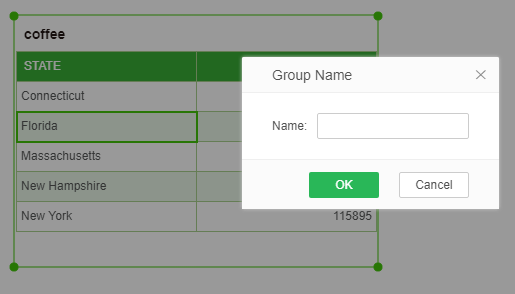
1. Use the mouse to select the fields you want to group, and then right-click on [Group Together] and you will see a grouping dialog box, as shown in the following figure:
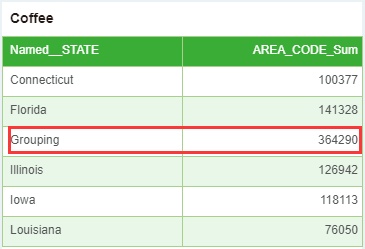
2. Click OK. The above two selected fields are grouped into one group. See the figure below:
➢For example 2: Grouping of the chart
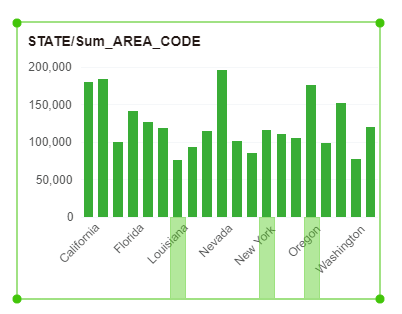
1. Use the mouse to select the fields you want to group, as shown below.
2. Select [Group Together] by right-clicking and the grouping dialog box will pop up. Set the group name, as shown in the following figure:
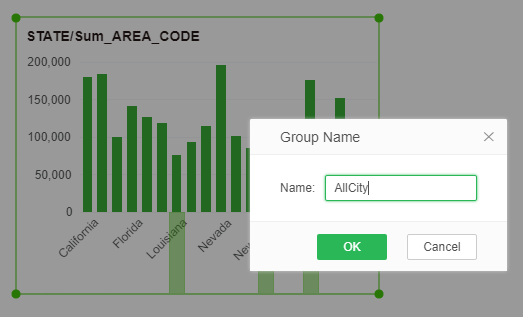
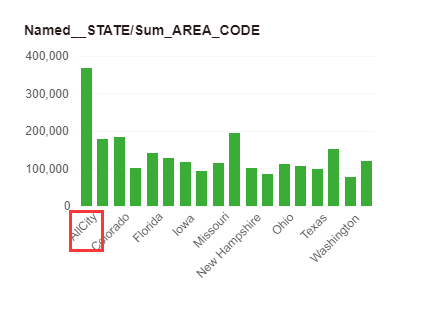
3. Click OK. The three selected fields are grouped into one group. See the figure below:
