|
<< Click to Display Table of Contents >> Radar&Fill Radar |
  
|
|
<< Click to Display Table of Contents >> Radar&Fill Radar |
  
|
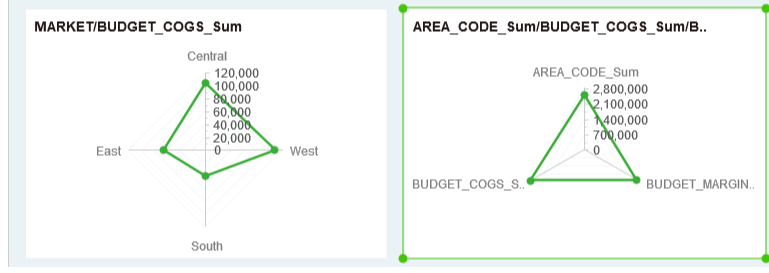
Radar maps can only bind metrics, and they can also be bound on the axis to display metrics.
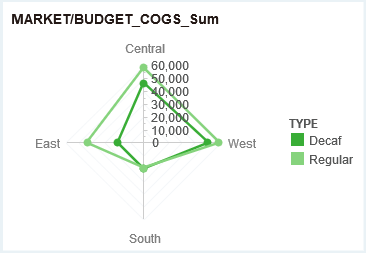
The first axis starts at an angle of 90 degrees. When only measures are bound on the axis, they are equally divided according to the number of metrics; the measure is bound on the axis, and the dimension is bound on the opposite side, and the dimension is divided equally according to the number of dimensions, and all dimensions are counterclockwise.
Grid lines will always be displayed as shown below:

The radar chart shows the changes in the values with respect to the center point, which may or may not display the marks for each data point.

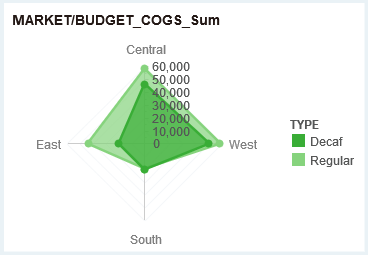
In a Fill Radar chart, the area covered by a series of data is filled with a color.
