|
<< Click to Display Table of Contents >> Migration Map |
  
|
|
<< Click to Display Table of Contents >> Migration Map |
  
|
The map supports migrating rendering and shows how the data target's position changes on the map. You can set up a migration animation to add dynamic migration effects.
❖Create Migration Map
•Data Preparation
Migration maps support map column positioning and support latitude and longitude positioning. But the data of the migration map needs two columns.
oData preparation for map column positioning:

oLatitude and longitude positioning data preparation:

•Create a migration map
oPosition by map column:
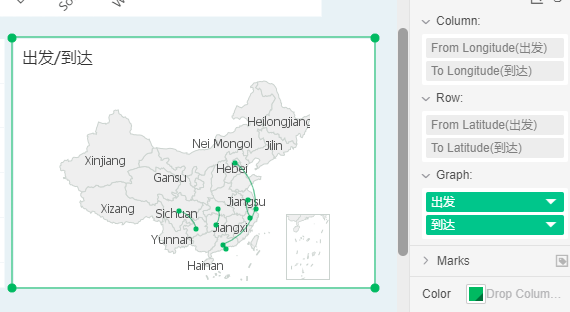
After binding the map column, open the drop-down list of the bound field. If you select this option, the migration will be rendered. The start column and the arrival column will be displayed on the Column axis and Row axis, as shown in the following figure:

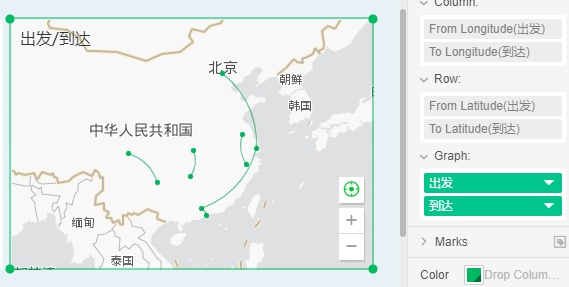
At this point, the migration map can be generated in the initial column and arrival column binding data:


oLatitude and longitude positioning:
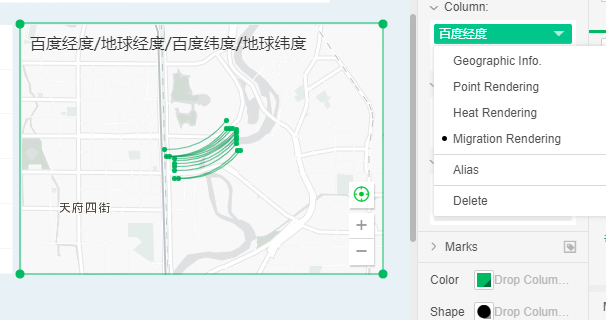
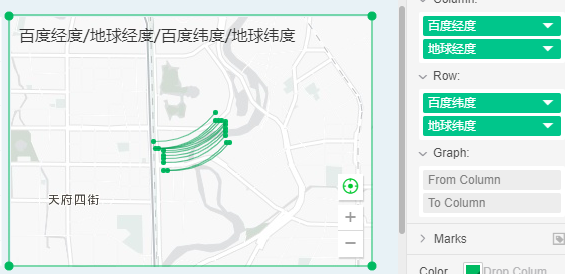
After binding latitude and longitude, open the drop-down list of the bound field, select the migration rendering, and the bound area on the axis is converted to the start column and the arrival column, as shown in the figure:

After binding the starting longitude, starting latitude, reaching longitude, and arriving at latitude, a migration map can be generated:
