|
<< Click to Display Table of Contents >> Box-plot |
  
|
|
<< Click to Display Table of Contents >> Box-plot |
  
|
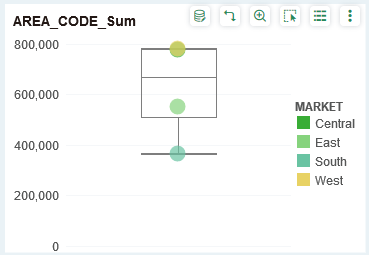
The Box-plot is a statistical graph showing the distribution of data, from which you can observe whether the distribution of data is dense, whether it is biased, and whether there is an outlier.
To create a Box-plot, you can first bind the Measure to the Column or Row axis and then bind the Dimension to the group or Mark group.
