|
<< Click to Display Table of Contents >> Label |
  
|
|
<< Click to Display Table of Contents >> Label |
|
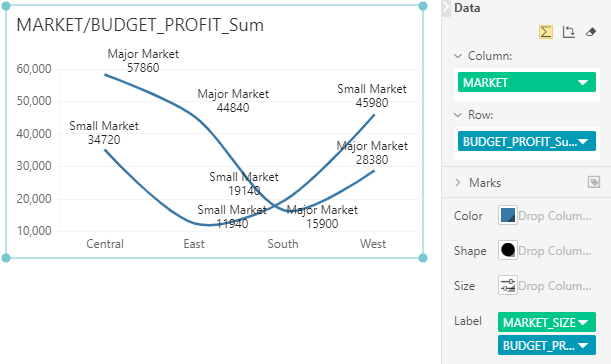
The user can drag one or more data columns in the current query to the label row, and display the corresponding label value on the chart label.