|
<< Click to Display Table of Contents >> Pivot drilling |
  
|
|
<< Click to Display Table of Contents >> Pivot drilling |
  
|
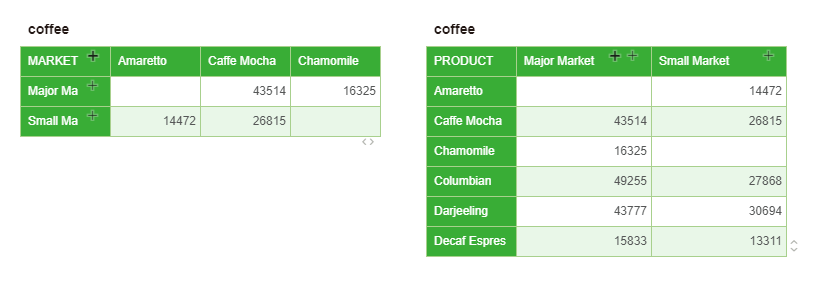
Pivots can drill on columns and cells for hierarchical fields. Drilling an entire column icon is shown by default in the first column of cells in the row header cells and column headers, as shown:

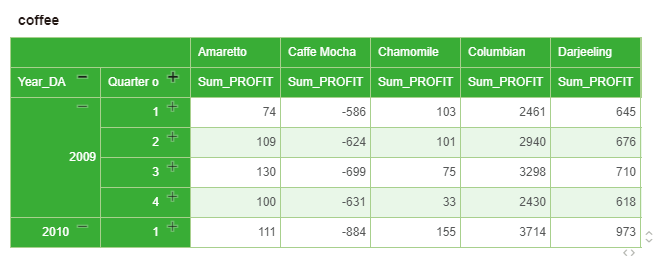
As shown in the figure below, binding the hierarchy field Year_DATE to the row header, binding the PRODUCT and PROFIT to the list header and total, and clicking the “+” button to drill down on the row header, you can view the corresponding values for all years. Quarterly PROFIT value:

Click the Drill All button to return to the previous drill down state. If you hide the row header name, the drill entire column icon appears on the first row of the row header, as shown:

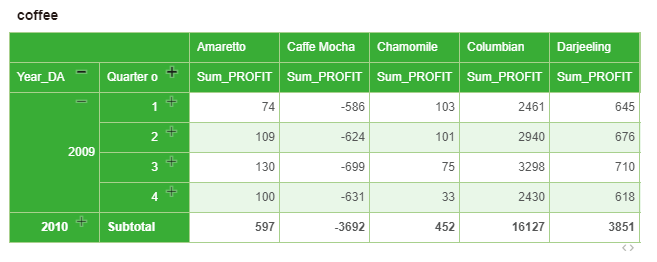
You can also use cell drill to view the PROFIT values for each quarter of a specific year. If you click the “+” drill-down button in 2009, you can view the PROFIT values for the four different quarters of the year, as shown in the following figure:

In the same way, when drilling, it will return to the state before drilling. Cross-tabs can drill on columns and cells for hierarchical fields. Drilling an entire column icon is shown by default in the first column of cells in the row header cells and column headers, as shown:

As shown in the figure below, binding the hierarchy field Year_DATE to the row header, binding the PRODUCT and PROFIT to the list header and total, and clicking the “+” button to drill down all on the row header, you can view the corresponding quarterly PROFIT values for all years:

Click the Drill Up All button to return to the previous drill down all state. If you hide the row header name, the drill entire column icon appears on the first row of the row header, as shown:

You can also use cell drill to view the PROFIT values for each quarter of a specific year. If you click the “+” drill-down button in 2009, you can view the PROFIT values for the four different quarters of the year, as shown in the following figure:

In the same way, when drilling, it will return to the state before drilling.