|
<< Click to Display Table of Contents >> Chart Drilling |
  
|
|
<< Click to Display Table of Contents >> Chart Drilling |
  
|
Drilling on charts is different from drilling on table components and pivota components. Drilling on tables and pivots is done in the form of increasing dimensions or reducing dimensional information, and on charts is Alternative forms show.
➢For example
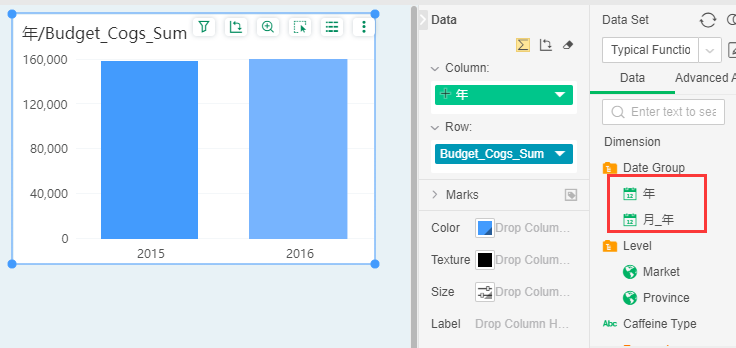
1. As shown in the figure below, create a chart, binding hierarchy field years.

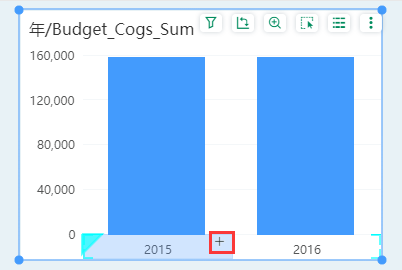
2. Drill down on the 2009 data and click on the drill symbol as shown below:

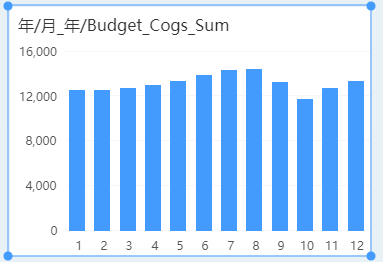
3. The result of drilling is the statistics of each quarter of 2009. At the same time, the quarter field appears in the binding window, as shown in the following figure:

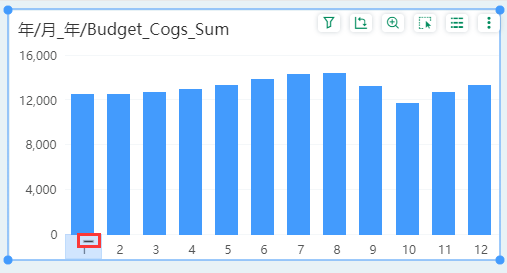
4. Because the quarter field is between the year field and the month field, both the drill button and the drill button are displayed on the chart. When the user continues to click on the drill button, the statistics for the three months of the first quarter of 2009 are displayed; if the drill button is clicked, the statistics for the year of 2009 and 2010 are displayed again.
