|
<< Click to Display Table of Contents >> Example Of Links |
  
|
|
<< Click to Display Table of Contents >> Example Of Links |
  
|
❖Common parameter transferring example
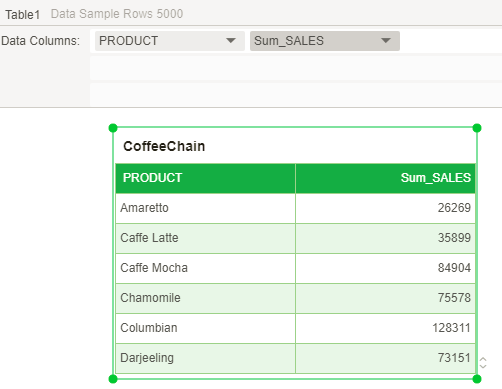
1. Create a new dashboard, create a new table component, bind the fields PRODUCT and SALES, as shown below:
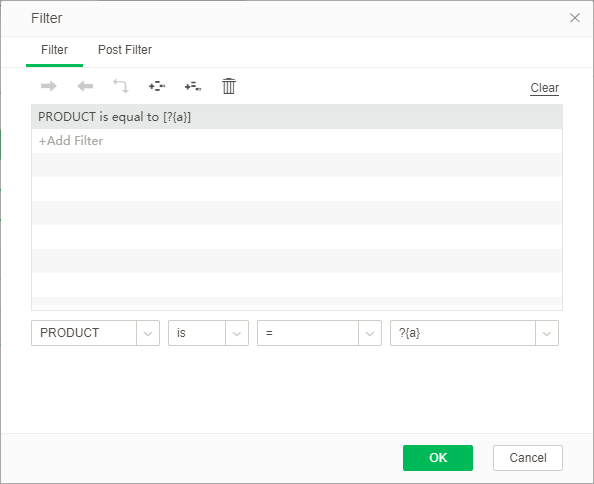
2. Create a filter on this table with a PRODUCT is equal to ?{a}, as shown in the following figure .Save the dashboard, assuming the name abc.
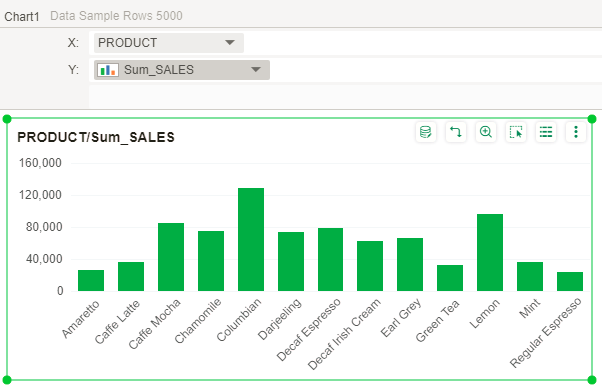
3. Create a new dashboard, create a new chart component, and bind the two fields PRODUCT and SALES of the same data source as the above dashboard, as shown in the following figure:
4. Create a link on the chart's mark, link to the abc dashboard, and pass the PRODUCT column to the parameter "a", as shown in the following image:
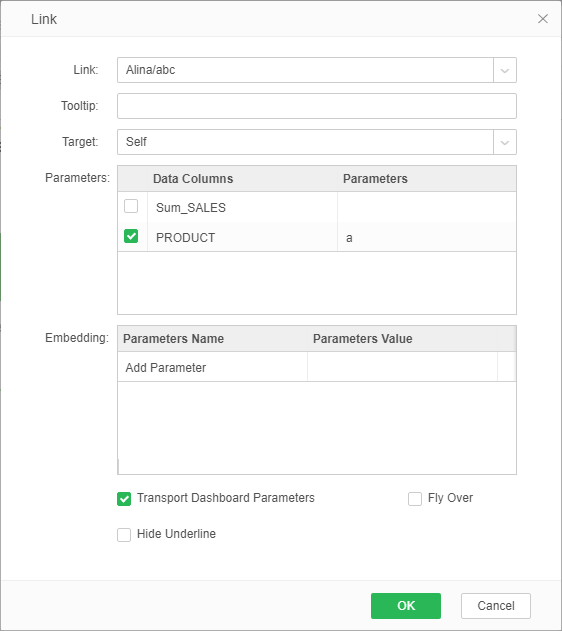
5. To preview the dashboard, click on the x-axis value Mint. In the current window, open the abc dashboard and pass the value of the corresponding axis to the table parameter a, as shown in the following figure:

❖Emded Parameters
Embed parameters can transfer user custom parameter information. For example, when the mouse points to Dr. Zhang, it needs to convey the personal information of Dr. Zhang to the interface. The operation is as follows.
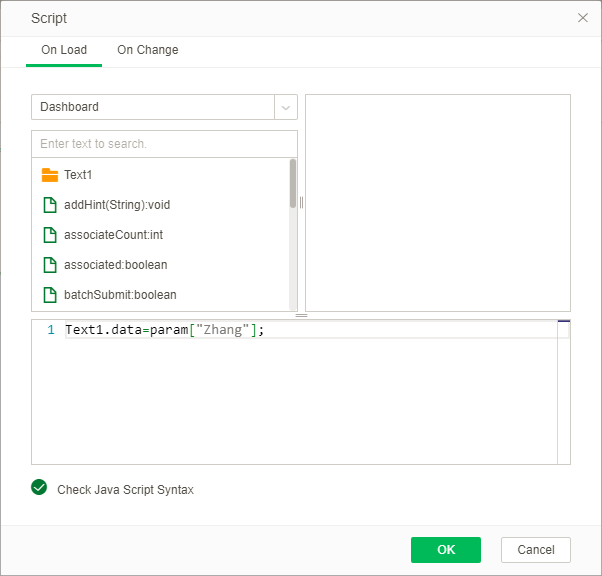
1. Create a new text component in the dashboard. Choose the script by clicking the right button in the blank. Edit the contents in the script dialog: Text1. data =param["Dr. Zhang"]. After completion, save the dashboard as "text1". As shown in the figure below:
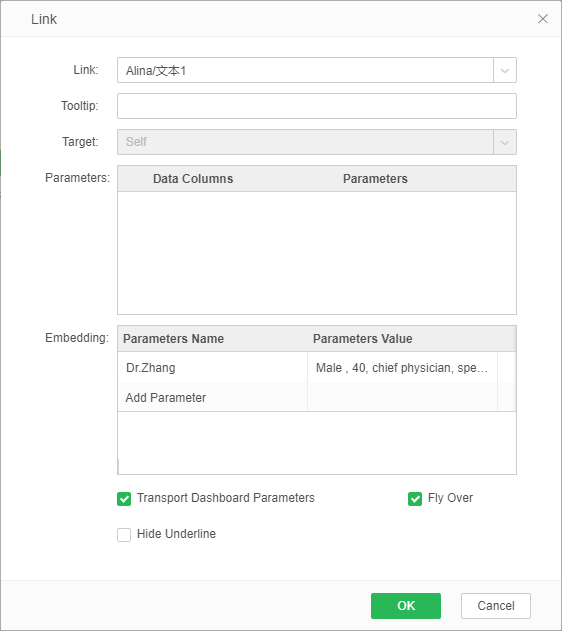
2. Create a new text component and enter Dr. Zhang. In the general of the right pane, select link. The link dialog opens. Set links as follows: linked to the dashboard "Text1", select the fly over, and add the embedded parameter to: Zhang, the parameter value is: Male , 40, chief physician, specializes in the diagnosis and treatment of common diseases of internal medicine, especially the diagnosis and treatment of hypertension, coronary heart disease, dyslipidemia in the elderly. When finished, save as Dashboard "Text 2". As shown below:
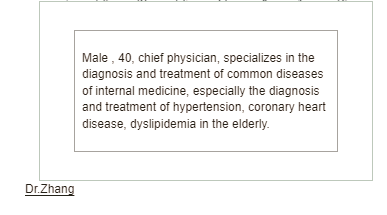
3. Open the dashboard “Text 2” to enter the preview mode. When the mouse points to Dr. Zhang, you can display Dr. Zhang’s personal information.
The effect is as shown in the figure:
❖Link to the column
For example, the table binding data is as follows:
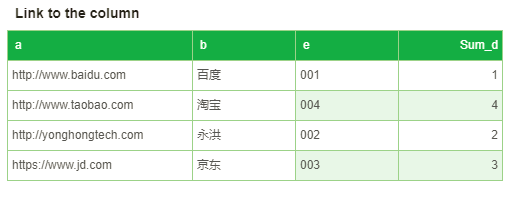
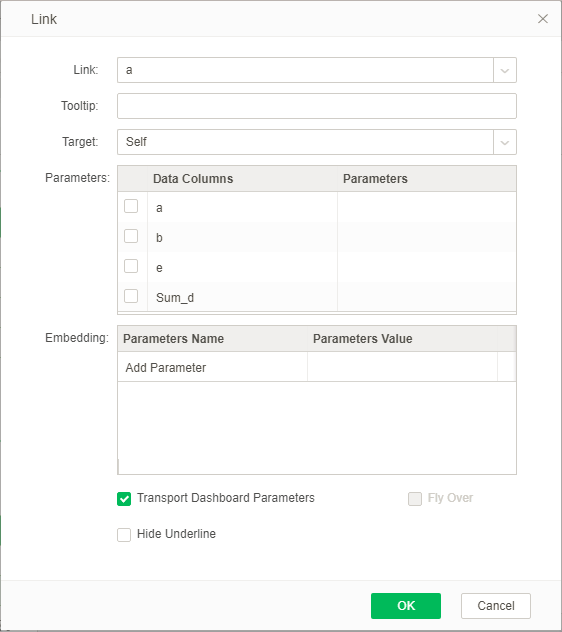
Set a hyperlink on the field "e" and link to the field "a" as shown in the figure:
After the preview, as shown:
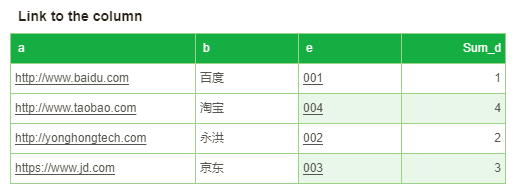
A link on the click field “e” will link to the corresponding URL of “a”. Click the "001" link to the Baidu page and click the "002" link to the Yonghong Home page.
❖Automatic monitoring of link
Take the table as an example. URL data bound to the table is as follows:
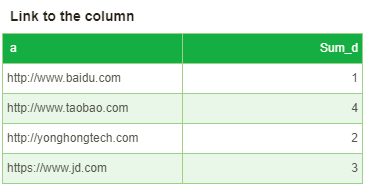
After previewing, automatically add links as shown below:
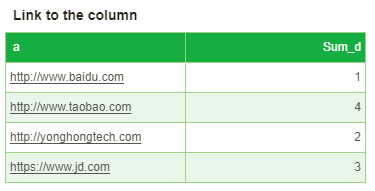
Click "www.baidu.com", Will connect to Baidu page.
❖Multilayer link
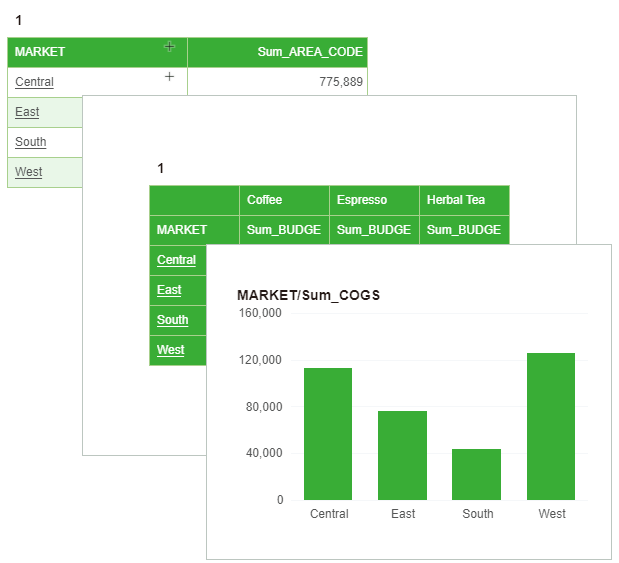
Set link on the table to pivot. Set link on the pivot to chart. Link mode is hovering as shown in the figure below:
