|
<< Click to Display Table of Contents >> Set Target Line |
  
|
|
<< Click to Display Table of Contents >> Set Target Line |
  
|
The user can set the target line in the chart through the right panel - setting.
Assume the following chart exists.
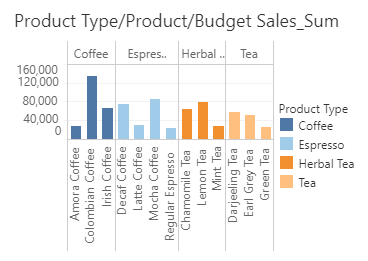
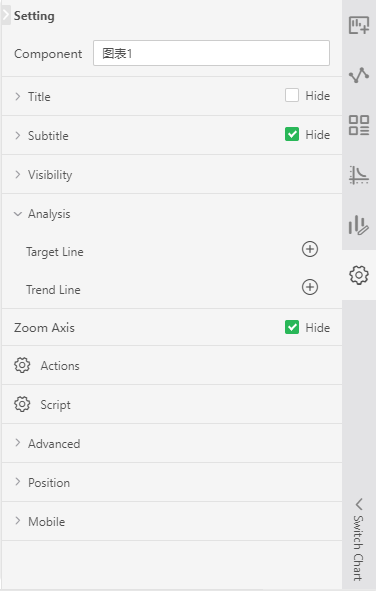
Select the chart, click Setting in the right panel, and click the Add button for the target line to open the Target Lines dialog box.
[Name] Set the name of the target line.
[Type] Set the type of the target line: Line, Section.
[Range] Set the range of the target line: Table, Aera, Cell.
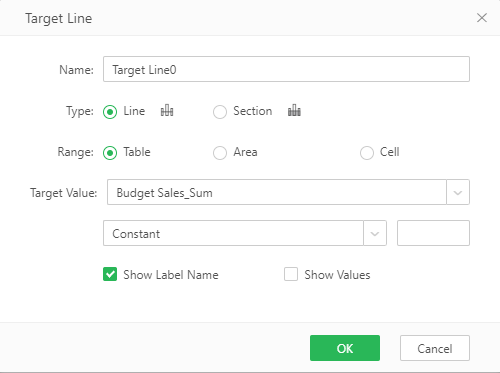
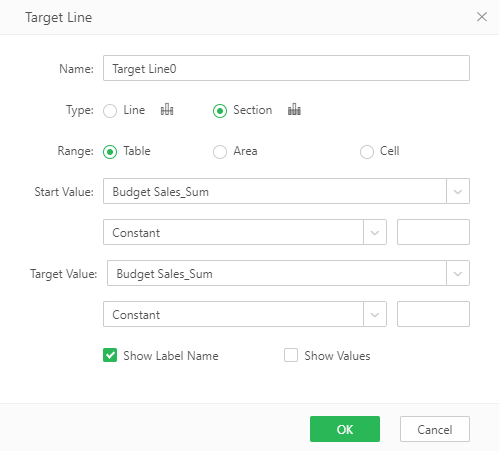
[Start value] Set the start value of the target line (it only works when the type is section): You can use the drop-down menu to select the calculation metric (selected in the bound metric column) and the calculation algorithm. Among the start values, a constant or a list of commonly used functions can be selected through the pull-down menu, and the selection of the parameters is also supported.
[Target Value] Set the target value of the target line: You can use the drop-down menu to select the calculation metric (selected in the bound metric column; the target value is determined by the measure column selected for the start value and cannot be modified when the type is section) and the calculation algorithm. Among the target values, a constant or a list of commonly used functions can be selected through the pull-down menu, and the selection of the parameters is also supported.
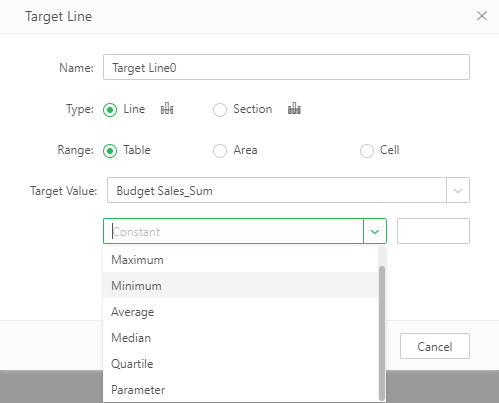
•Constant: The default initial value is a constant. The user can enter the desired value in the text input box that appears on the right side.
•Common functions: The user can select the function: maximum, minimum, average, and median. The calculated value of the metric column is used as the target value.
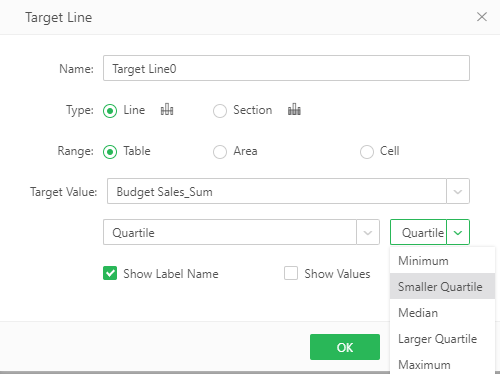
•Special Functions: Quartile, after the selected quartile, there is a drop-down menu to the right, you can choose the value you want to output: Minimum, Smaller Quartile, Median, Larger Quartile, Maximum. The default is: smaller quartile, as shown below:
•Parameter: Select parameter, a drop-down list will appear on the right, which contains all the parameters that already exist in the report. The user can select the parameters in the list, or enter new parameters manually.
[Label Style] Users can set whether the label name and value of the target line are displayed.
•Show Label: The user can set whether the label name of the target line is displayed.
•Show value: The user can set whether the value of the target line is displayed.
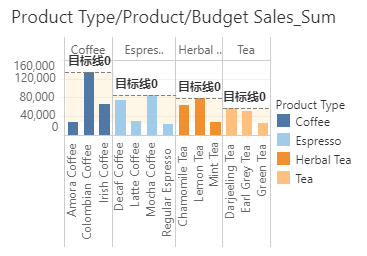
The effect after setting the target line is as follows:
