|
<< Click to Display Table of Contents >> Set Trend Line |
  
|
|
<< Click to Display Table of Contents >> Set Trend Line |
  
|
The user can set the trend line in the chart through the right panel - setting.
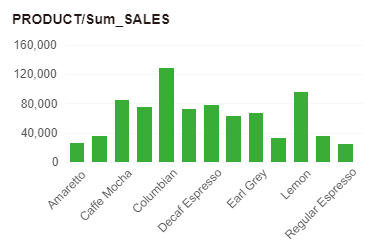
Assume that there is a chart below.

Select the chart, click Settings in the right panel, and click the Add button for the trend line to open the Trend Line dialog box.

[Name] Sets the name of the trend line.
[Line] Users can set the style and color of the trend line.
[Measure] The user can select which tag field to set the trend line for.
[Type] includes exponent, linear, logarithm, power, and polynomial, and the user can select it as needed. When the user selects a polynomial, the polynomial power option is active.
•Exponent: The application curve shows data values that rise or fall at increasingly higher rates. For the index trend line, the data should not contain zero or negative numbers.
•Linear: Applying the most suitable simulated line shows a simple linear data set containing data values that increase or decrease at a steady rate.
•Logarithm: Apply the most suitable fit curve to show rapid increase or decrease in data values before stabilization. For a logarithmic trend line, the data can contain negative and positive numbers.
•Power: The application curve shows the comparison of data values of measured values that increase at a specific rate. For power trend lines, the data should not contain zero or negative numbers.
•Polynomial: Apply curve to display the change data value. Click this option, and then enter an integer between 2 and 6 in the Times box to determine the number of bends (peaks and valleys) that appear in the curve. For example, if you set the value of the polynomial power to 2, the chart usually shows only one peak or valley, the value 3 shows one or two peaks or valleys, and the value 4 shows up to three peaks or valleys.
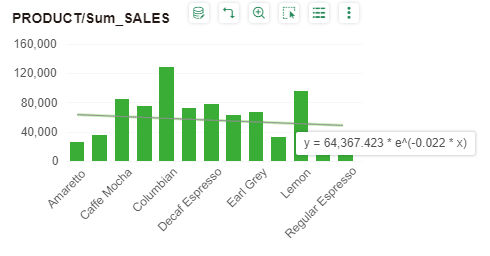
The trend line can be clicked. When the mouse moves to the trend line, the formula of the trend line is displayed. As shown in the figure below, it corresponds to the index trend line in the above chart.
