|
<< Click to Display Table of Contents >> Drilling |
  
|
|
<< Click to Display Table of Contents >> Drilling |
  
|
Drilling operation includes drill-up, drill-down, and drill-through. Drill-up and drill-down are applied to tables, pivots and charts. And drill-through is only applicable to charts. Chart drilling will affect other component data linkage.
❖Hierarchy setting
The hierarchy relation between data fields is set in query. Set a new hierarchy by right click at metadata section, input the hierarchy name and a hierarchy folder will be generated under the dimension directory. The user can drag and drop the data field into the hierarchy. Pay attention that the sorting of data fields under the hierarchical folder determines the hierarchical relationship between data fields. It is default that the hierarchy of the above data field is the max and so on.
The detailed introduction of hierarchy is as shown in data type and field type.
❖Drill-down
•Binding Panel
Drill-down is to automatically add a field one level below your level. Assuming that there are three data sections for the year, quarter, and month in the query, the year includes the quarter, the quarter includes the month, and the bound panel binds the year data segment, then there is a plus sign “+” before the year data segment when the user clicks When you add a sign, a lower-level data segment will be added in the binding window than the current data segment level.
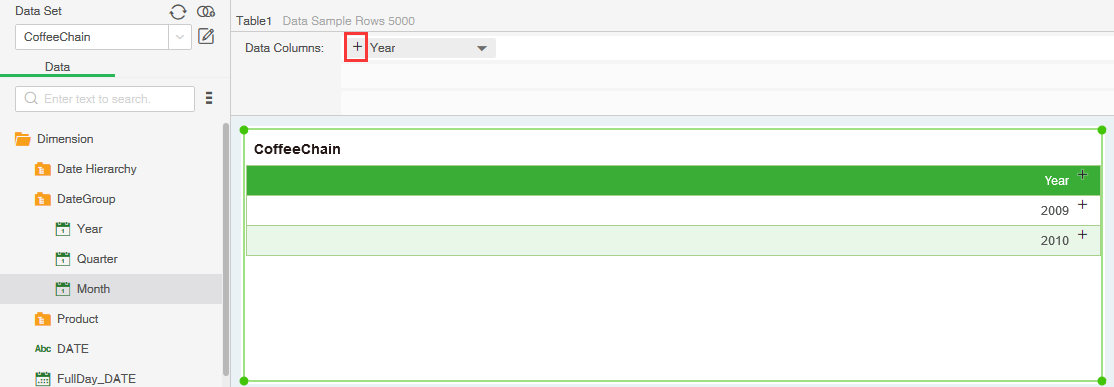
•Cell
Tables and pivots support cell drill-down, as shown in the figure below:

•Chart drilling linkage
1.Chart drill-down
Place the mouse at axis data location to show the drilling icon. (For different chart types, the locations of drilling icon will be different respectively. For example, the drill icon of organization chart is above the tag. And the drill icon of map is triggered by right click).
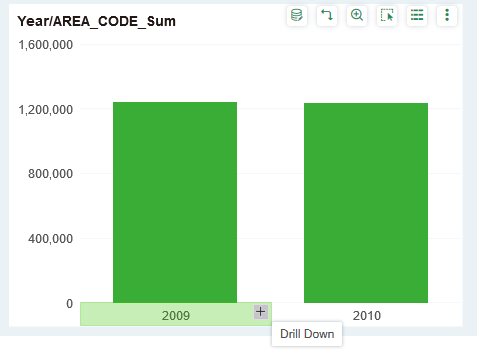
➢Note:In case of any drill icon on the chart axis and mark, It supports displaying when the mouse over and disappearing when mouse out.
2.Chart drill-down will drive linkage
The original data is as shown below.
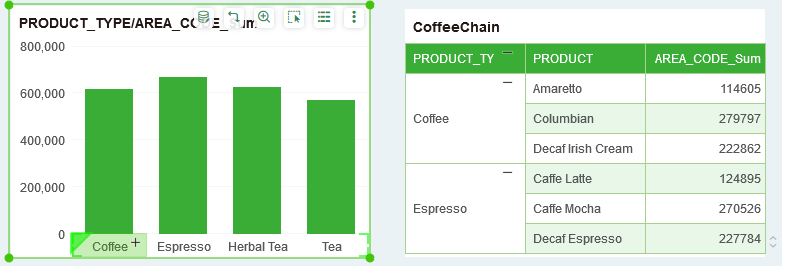
Click the drill-down icon of Coffee on the chart axis. Data after drilling is as shown in the figure below.
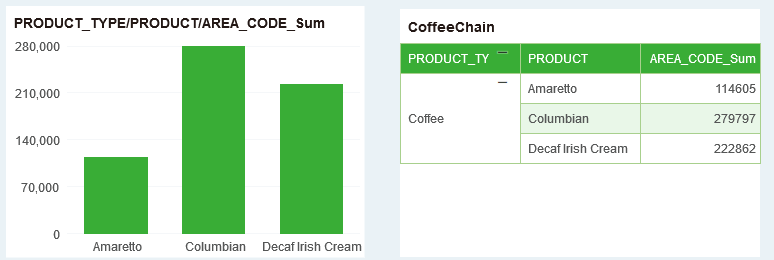
➢Note:Treemap and organization chart do not support the linkage
❖Drill-up
•Binding panel
Drill-up is to delete the lower level fields on the hierarchy out of the binding window. It is assumed that year, quarter and month data fields exist in the query. Year contains quarters and quarter contains months. Bind quarterly data fields to the binding interface by adding a "-" before quarterly data field. When the user clicks the "-", all data fields lower than current data field will be deleted from the binding panel.
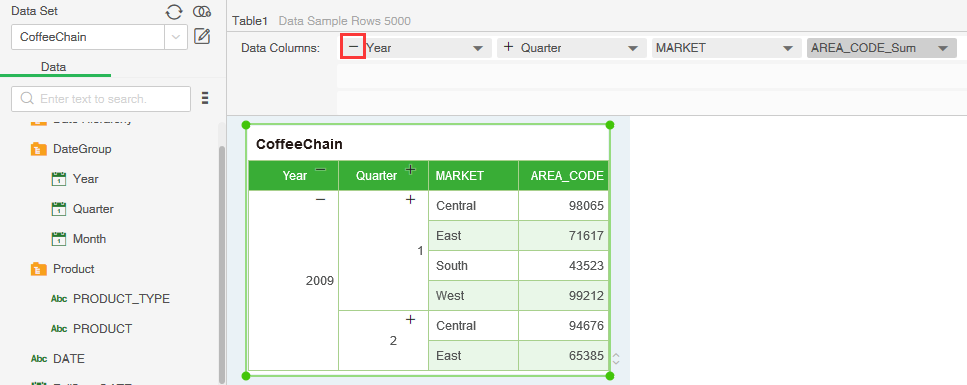
•Cell
Tables and pivots support cell drill-up and drill-down.
•Chart drilling linkage
1.Chart drilling linkage
Place the mouse at axis data location to show the drilling icon. (For different chart types, the locations of drilling icon will be different respectively. For example, the drill icon of organization chart is above the tag. And the drill icon of map is triggered by right click)
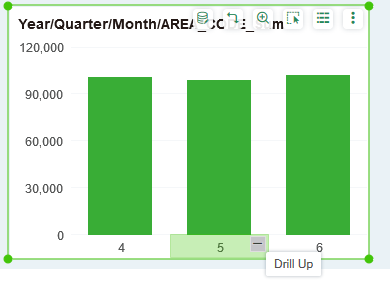
2.Chart drill-up will drive linkage
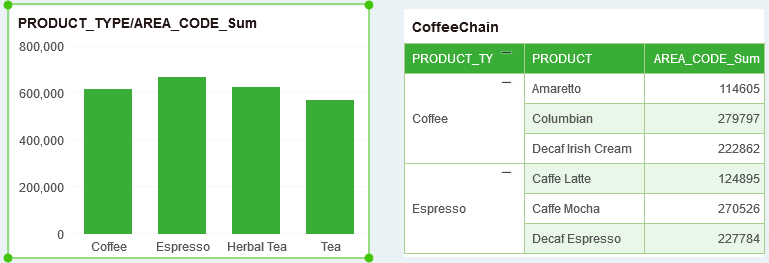
The original data is as shown below.

Click the drill-up icon of Amaretto on the chart axis. Data after drilling is as shown in the figure below.
❖Drill-through
It is only applicable to charts,Show specific data button ![]() in the chart to conduct data drill-through. Select the specified area of the chart and click this button to display the detailed data. Only the data of the specified area is displayed in the detailed data. As shown in the figure below, select the chart X-axis data "Coffee" and click on the detailed data. The "PRODUCT_TYPE" column shows only the "Coffee" data in the detailed data.
in the chart to conduct data drill-through. Select the specified area of the chart and click this button to display the detailed data. Only the data of the specified area is displayed in the detailed data. As shown in the figure below, select the chart X-axis data "Coffee" and click on the detailed data. The "PRODUCT_TYPE" column shows only the "Coffee" data in the detailed data.
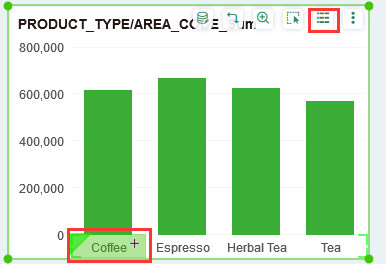
Different regions send different dimension information. When there is no dimensional information in the chart, all data will be displayed by default.
Chart area |
Description |
|---|---|
Mark |
You can select a mark, or use the Ctrl key to select more. After clicking the Display Specific Data button, the dimension information corresponding to the marker is used as a condition for filtering the display data. |
Axis |
For axis binding with dimensional data fields, you can select a coordinate, or use the Ctrl key to select more. After clicking the Display Specific Data button, the dimension information corresponding to the marker is used as a condition for filtering the display data. |
Legend |
For legends binding with dimensional data fields, you can select a legend option, or use the Ctrl key to select more. After clicking the Display Specific Data button, the dimension information corresponding to the marker is used as a condition for filtering the display data. |
Mark value |
You can select a tag, or use the Ctrl key to select more. After clicking the Display Specific Data button, the dimension information corresponding to the marker is used as a condition for filtering the display data. |