|
<< Click to Display Table of Contents >> Create Measure Group |
  
|
|
<< Click to Display Table of Contents >> Create Measure Group |
|
Users sometimes encounter not only the value inside the same tag, but also the value of multiple measures. This depends on how the user's data is defined. If there is a column of data that is a product, a column of data is sold in Beijing. Amount, a column of data is sales in Shanghai, a column of data is sales in Nanjing, then the stack is more meaningful.
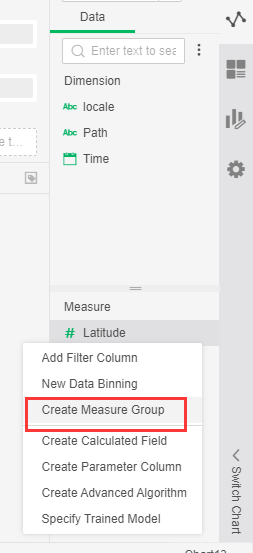
➢For example, a measure group can be created in the menu More on the bound tree of the chart, as shown below:
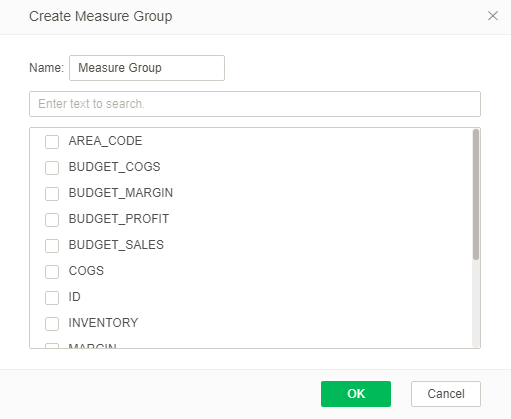
And then, there will be popped up the dialog for creating a new measure group:
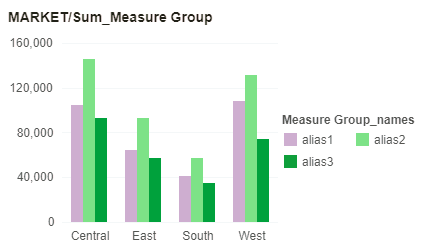
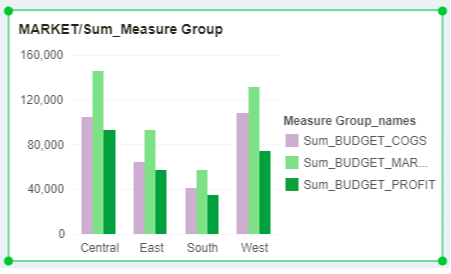
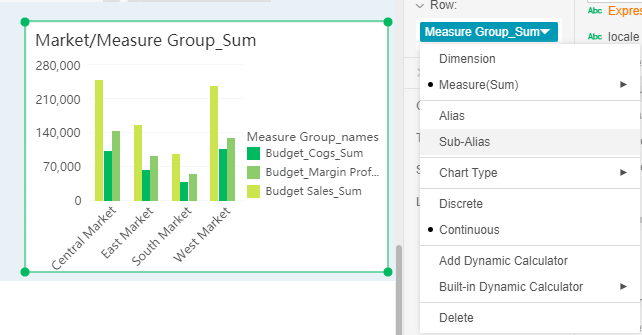
Enter the name of the measure group, tick the Measure that you want to create the measure group, click OK to generate the measure field named measure group, and also create a dimension field of the measure group_names under the dimension, bind the measure group_names Set to beautify the interface, at this time implement all the metric fields in a group can be stacked and displayed, the effect shown here is as shown in the figure:
You can alias the fields in a bound measure group as follows:
After clicking on the Sub-Alias menu, you can modify the alias in the dialog box that pops up. The situation is as shown in the figure below:
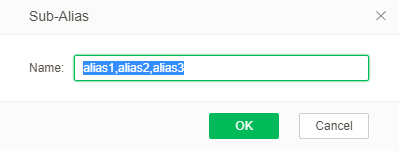
Click OK after the situation as shown below: