|
<< Click to Display Table of Contents >> Texture |
  
|
|
<< Click to Display Table of Contents >> Texture |
|
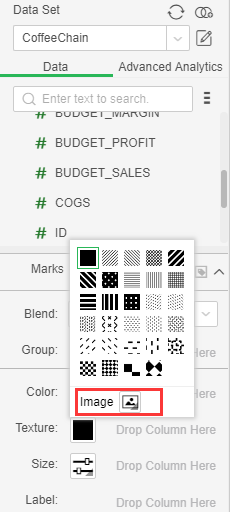
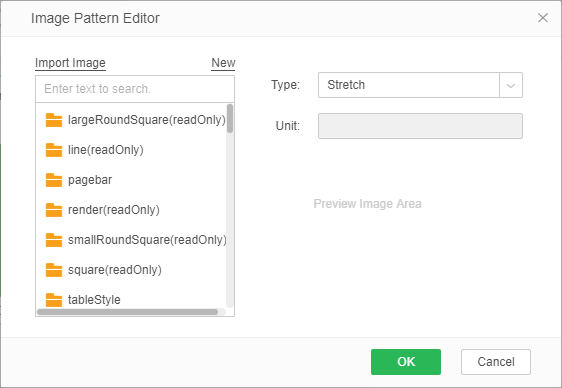
When the chart type is a bar chart, a pie chart, a donut chart type, a marker pattern can be set on the aesthetic interface. In the marking pattern, the user can click on the Image option to open the pattern editor to set the picture as the marked pattern. In the pattern editor dialog box, the user double-clicks the image in the left picture list, and the example image is displayed at the bottom right. The user can set the type of the image and repeat it by stretch, repeat, and repeat scaled.
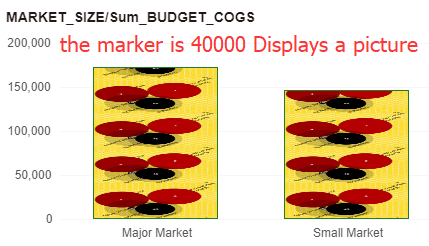
When the user selects to stretch, the marker only displays a picture; when the user selects to repeat, the marker repeats the display of the picture according to a fixed ratio; when the user selects to repeat scaled in proportion, the user can set the unit length, such as 40000, then the marker is 40000 Displays a picture. When the user chooses to stretch or repeat, units cannot be set and the unit is inactive.
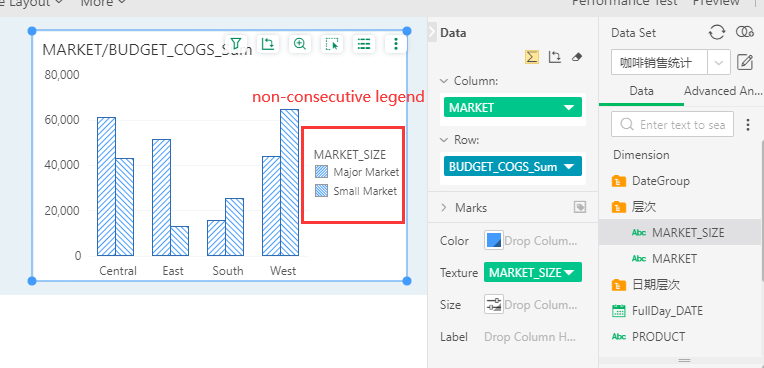
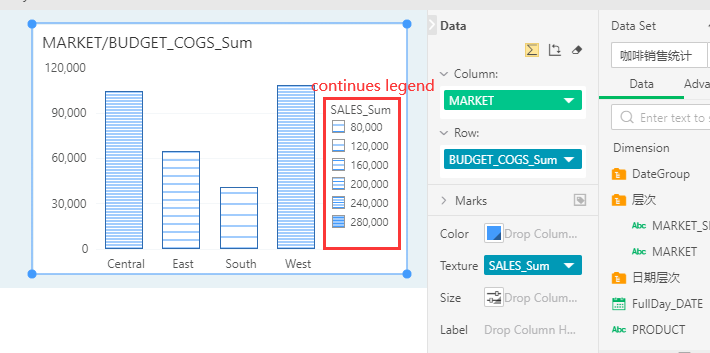
The user can also drag and drop the data segment in the current query into the pattern line, and then generate a corresponding legend on the chart. When the user drags the data segment under the dimension directory, a non-consecutive legend is generated on the chart; when the user drags When measuring a data segment under a directory, a continuous legend is generated on the chart.
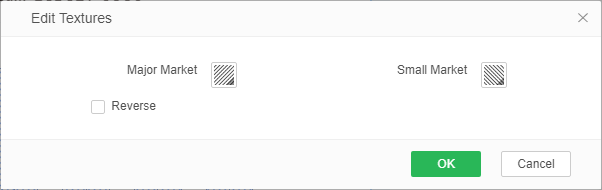
The user can also edit textures of the legend in the drop-down list of dragged data segments. There is a reverse option in the pattern editing dialog box of the dimension data segment. When this item is checked, the data display sequence in the legend is reversed.
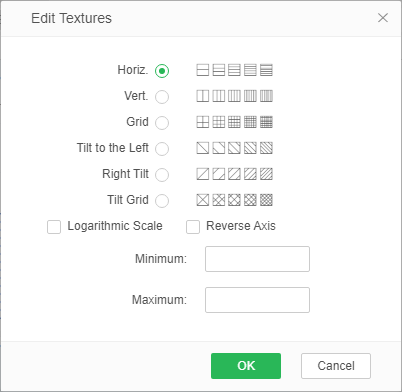
When the user drags the data segment under the metrics list, the legend of the legend can be set in the edit textures dialog of the metric data segment, and can be displayed in the form of horiz., vert., grid,Tilt to the Left,Right Tilt, or Tilt Grid. When the logarithmic scale attribute is checked, the range of the legend is displayed as the logarithm of the value of the data segment. The user can customize the minimum and maximum values displayed by the legend.
Types |
Instructions |
|---|---|
Horiz. |
Horizontal direction, from sparse to dense |
Vert. |
Vertical direction, from sparse to dense |
Grid |
Cross grid, from sparse to dense |
Tilt to the Left |
Left-leaning direction, from sparse to dense |
Right Tilt |
Slope to the right, from sparse to dense |
Tilt Grid |
Slanted grid, changing from sparse to dense |