|
<< Click to Display Table of Contents >> Fonts and Colors |
  
|
|
<< Click to Display Table of Contents >> Fonts and Colors |
  
|
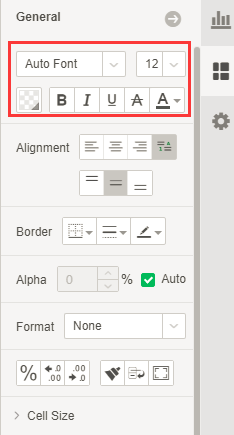
From left to right from top to bottom are:
[Font] Set the font.
[Size] Select font size.
[Background Type] Background types include monochrome, gradient (including single color add double color), images, and patterns. The pattern can only be set on the mark of the chart component.
•monochrome
The user can select the color in the expanded color panel to set the background color, or click the More Color button![]() ,Customize colors as needed.
,Customize colors as needed.
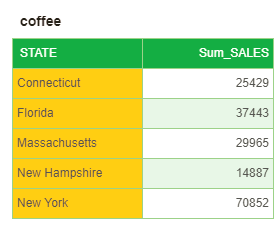
Set the color of the cell in the table to yellow, as shown below:
•Monochrome and Double color Gradients
The user can click the gradient button in the background color panel to open the dialog for setting the gradient color, as shown in the following figure:
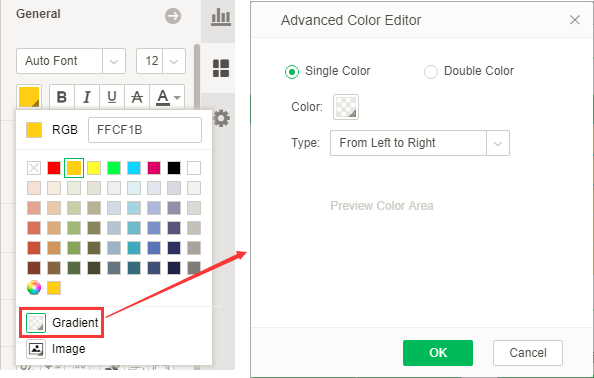
When selecting single color, the user can set the color and gradient type. By default, the gradient type is selected from left to right, and the user can select according to his needs.
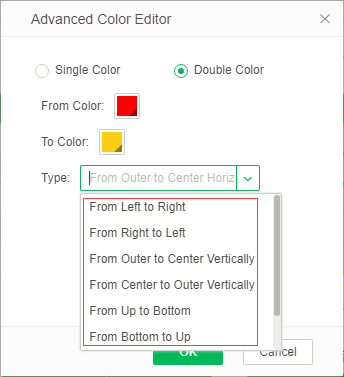
When double color are selected, the user can set the from color, the to color, and the gradient type. This product provides a variety of color gradient types, the user can choose according to the needs, as shown below:
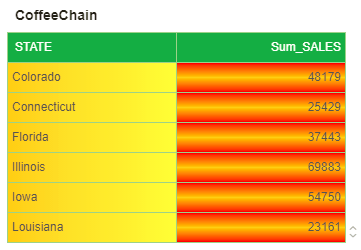
Set the color of the cell in the first column of the table to yellow, the gradient to from left to right, the color in the second column to the from of the setting is red, the end of the color is yellow, the gradient is from outer to center Vertically, As shown below:
•Image
The user can click the image button in the background color panel to open the image editor dialog. The user can import the image, click on the name of the image in the list, and preview the image in the right area. The types of images are divided into stretch, repeat, and scale9 (when the mark is a histogram, the type of image is divided into stretch, repeat, and repeat scaled.
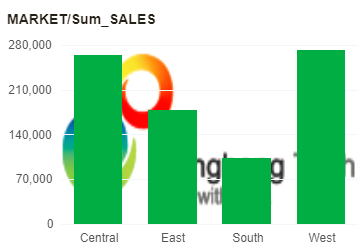
When the image type is stretched, the image is displayed according to the aspect ratio of the current chart area, as shown in the following figure:
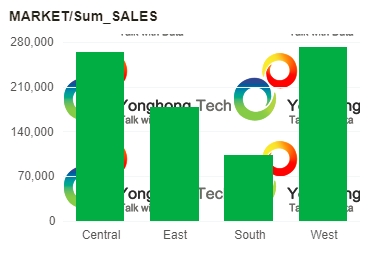
When the type of the image is duplicated, the image is repeatedly displayed on the chart area according to the proportion of the original picture. When the original image is smaller than the area of the chart, it is displayed repeatedly on the chart, as shown in the following figure:
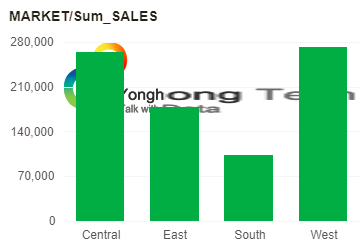
When the type of the image is scale9,the user can set the zoom position, and the current image is zoomed in this position area on the chart. For the principle of the scale9,please refer to the description of this part in“Setting Image Properties”.Repeatedly. Set top 100px, bottom 200px, left 100px, right 200px as shown below:
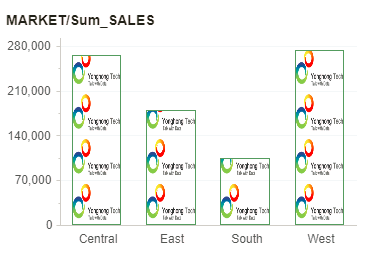
When setting the histogram mark background image type is proportional, the user can set the repeat unit, and one unit displays a picture. For example, if the setting unit is a major scale value of the metric axis, the current image is displayed in the histogram mark area as shown below:
•Pattern
This setting is only available on the mark of the chart component.This section refers to the detailed description of the marked area in "Setting The Chart Format".
[Font Style] Set styles for fonts respectively: bold, italic, underline, strikethrough, font color.